Vampir - Performance Optimization
Latest news
Latest release
-
25
Mar
2024There is a new Vampir 10.4.2 bugfix release available now.
Notable changes:
- Fix _Master Timeline_ ...
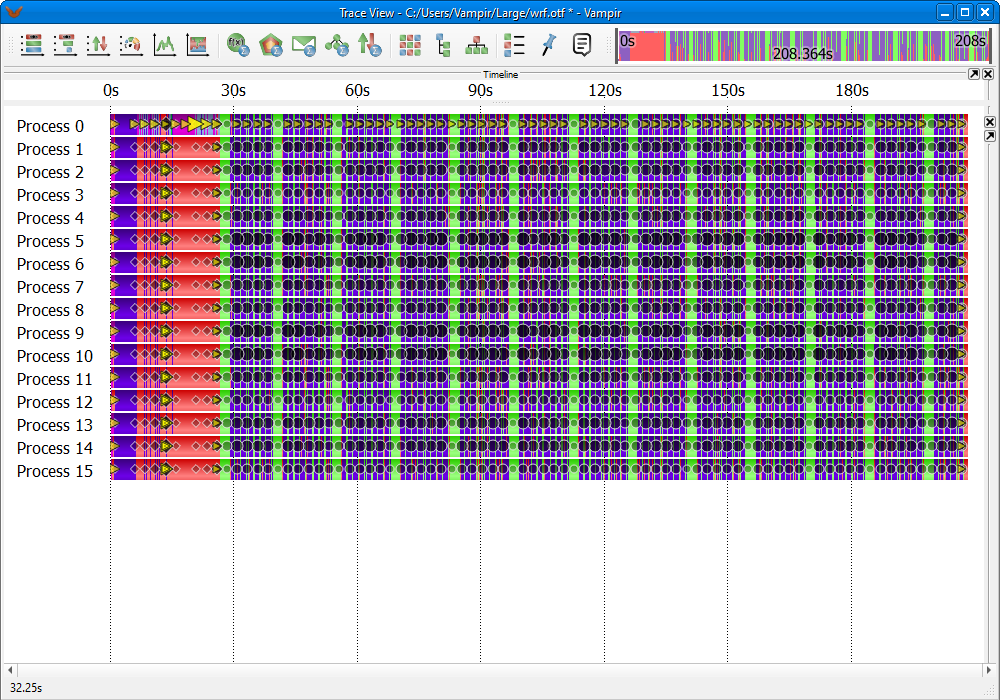 Vampir 10.4: Master Timeline
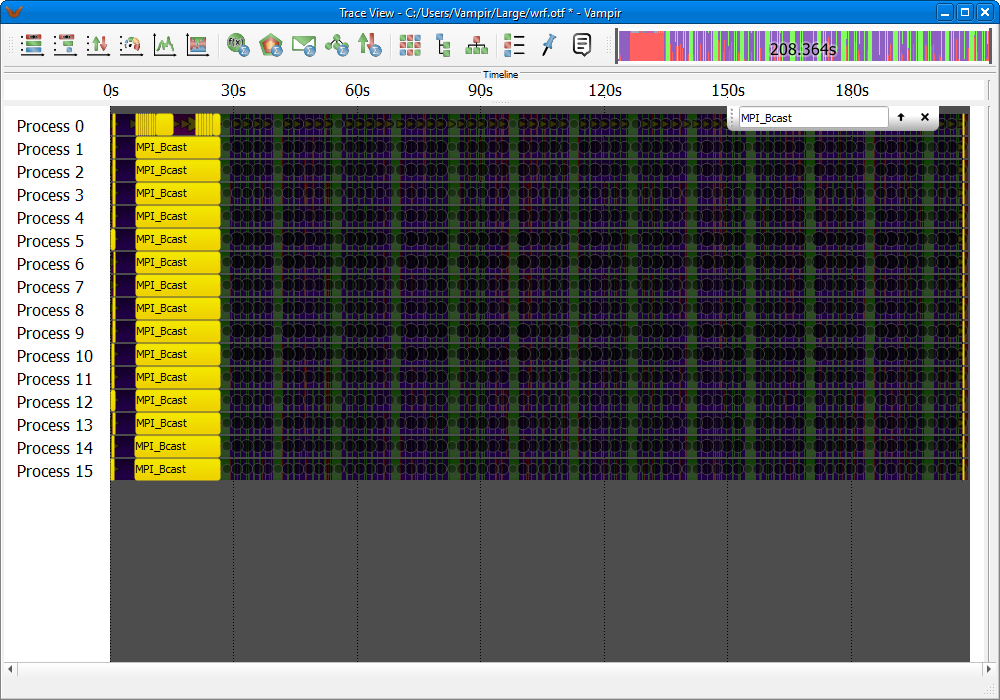 Search for MPI_Bcast in the Master Timeline
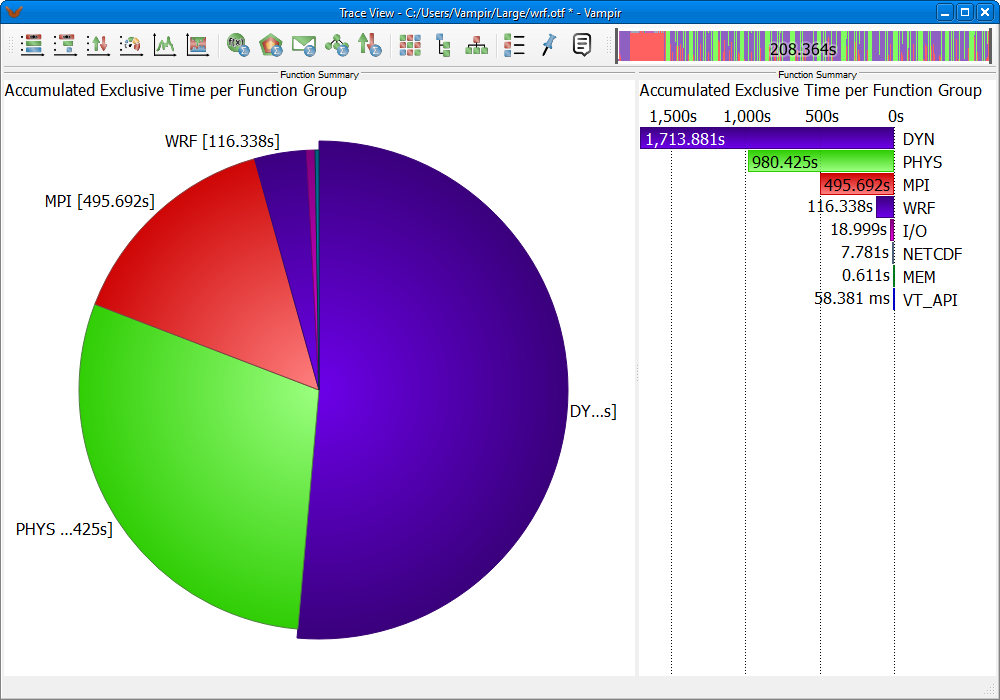 Vampir 10.4: Function Summary
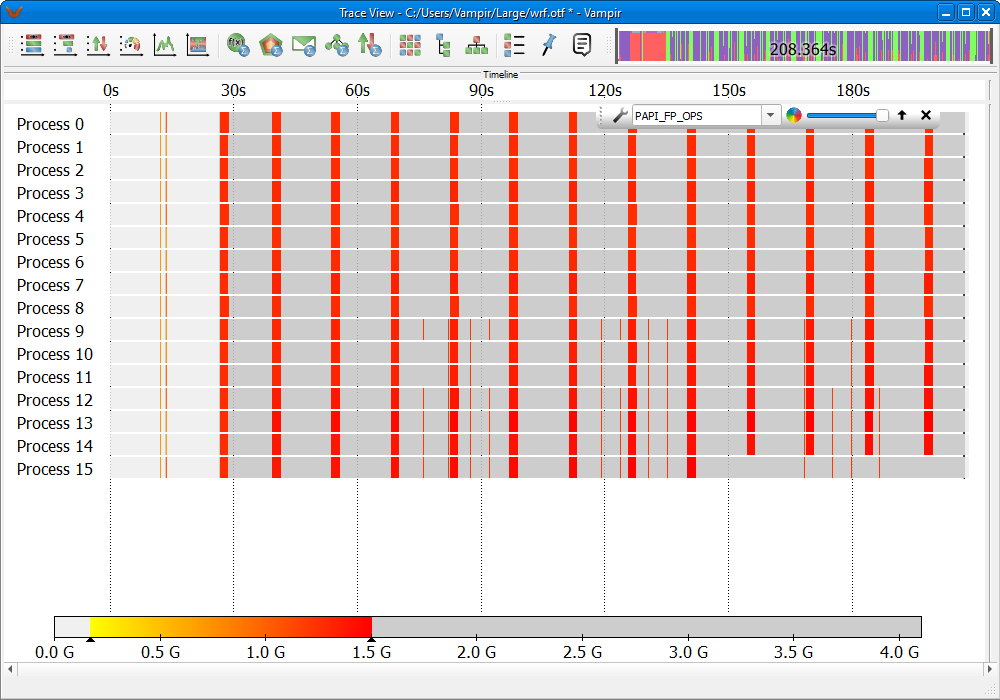 Master Timeline highlighting areas with low FLOP rate
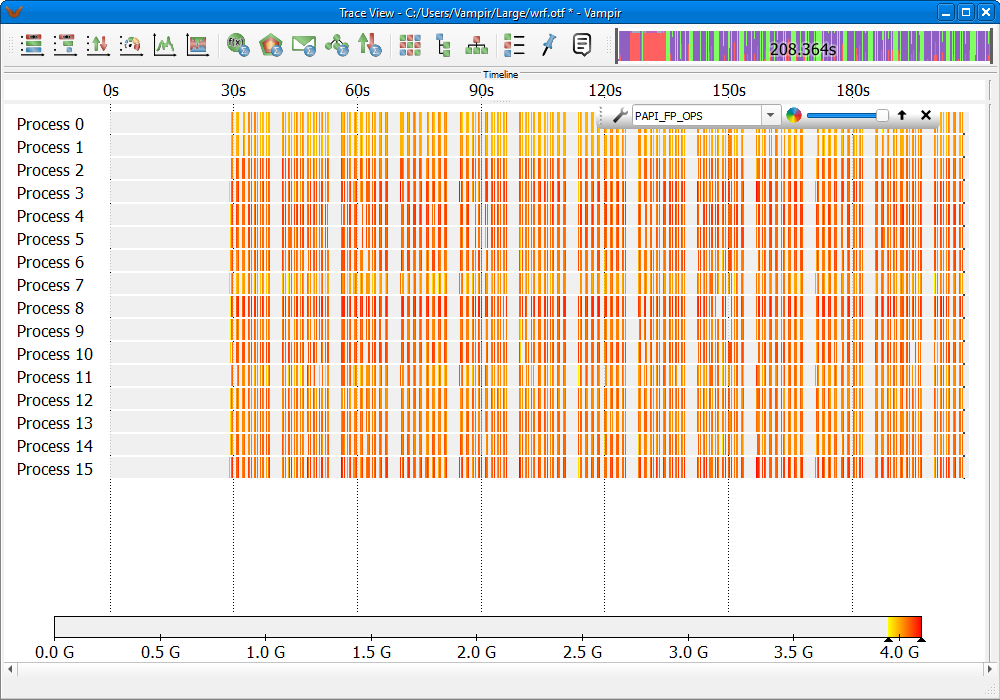 Master Timeline highlighting areas with high FLOP rate
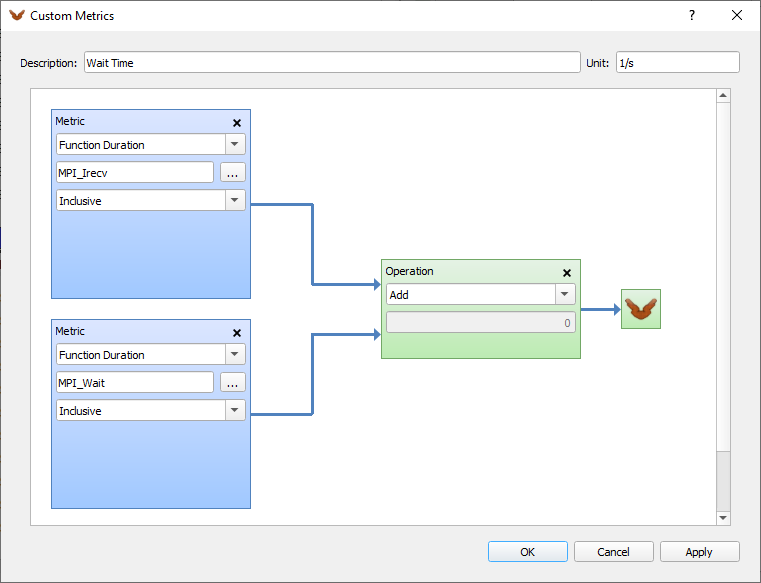 Vampir 10.4: Custom metrics editor
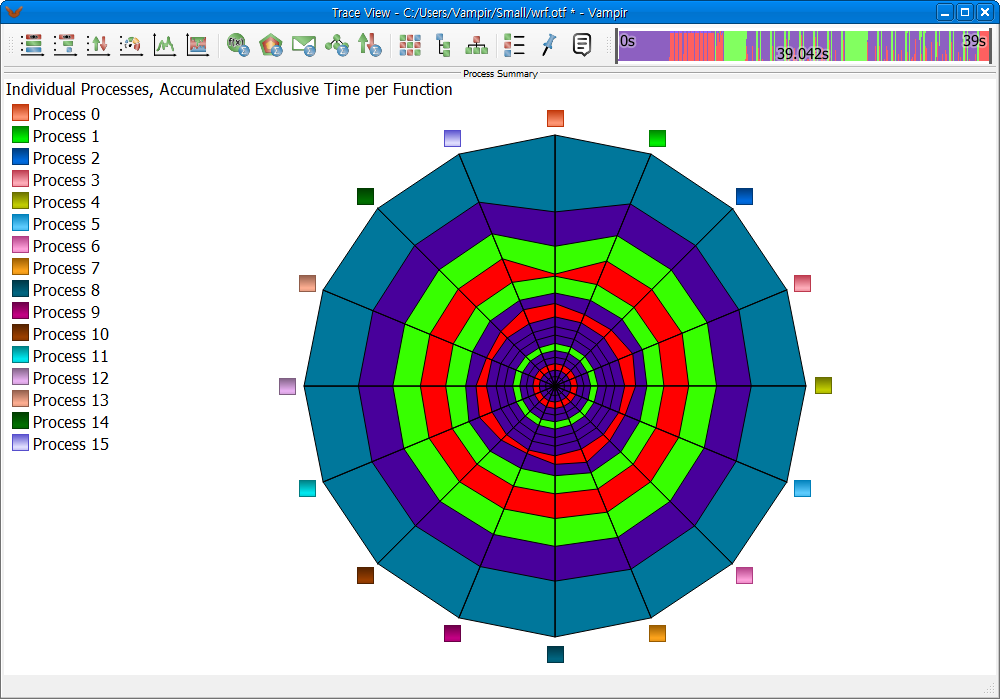 Vampir 10.4: A kiviat chart mode in the process summary chart
Vampir 10.4 provides an easy-to-use framework that enables developers to quickly display and analyze arbitrary program behavior at any level of detail. The tool suite implements optimized event analysis algorithms and customizable displays that enable fast and interactive rendering of very complex performance monitoring data.
The combined handling and visualization of instrumented and sampled event traces generated by Score-P enables an outstanding performance analysis capability of highly-parallel applications. Current developments also include the analysis of memory and I/O behavior that often impacts an application's performance.
Score-P is the primary code instrumentation and run-time measurement framework for Vampir and supports various instrumentation methods, including instrumentation at source level and at compile/link time.
Vampir and Score-P provide a performance tool framework with special focus on highly-parallel applications. Performance data is collected from multi-process (MPI, SHMEM), thread-parallel (OpenMP, Pthreads), as well as accelerator-based paradigms (CUDA, HIP, OpenCL, OpenACC).